PEO Governance: The Missing Discipline in Co-Employment Relationships – Post 3 of the PEO Governance Series
Knowing the problem is not the same as solving it.
- Most business owners now understand that PEO governance matters.
- Far fewer have a system to practice it.
In the first two posts of this series, we established two foundational principles. First, that most small and mid-size businesses stop governing their PEO relationship the moment onboarding is complete. Second, that governance lives in six specific domains — financial, risk, strategic alignment, operational, cultural, and exit — each of which demands structured quarterly review.
Understanding those principles is essential. But understanding without implementation changes nothing.
Governance requires structure. Structure requires a system.
This post delivers the system. A practical, implementable framework we recommend to clients — one that transforms PEO oversight from passive assumption into active, measurable discipline.
And the timing matters. The 2025-2026 regulatory environment has introduced an unusually dense wave of changes that directly impact PEO operations: new federal payroll withholding rules under the One Big Beautiful Bill Act, Secure 2.0 retirement plan mandates, expanding state paid family and medical leave programs, AI employment regulation at the state level, and IRS guidance reclassifying certain PEO-related contributions as taxable wages. Each of these changes creates new compliance obligations, new invoice components, and new points of potential failure. A governance framework is no longer optional. It is urgent.
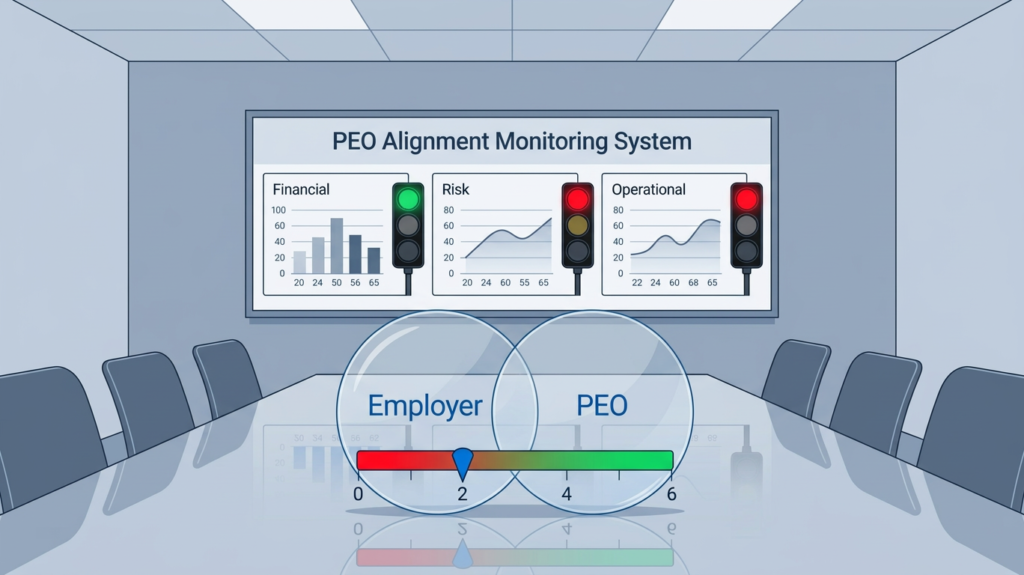
We call it the PEO Alignment Monitoring System. Learn More: Boost Your Business Growth Now: The Power of PEO Collaboration
Step 1: Define the Original Intent
Before you can measure drift, you must document what alignment looked like at the start.
This is the step most businesses skip entirely. The PEO relationship begins with verbal agreements, proposal summaries, and a signed contract. But no one documents — in plain, strategic language — why the company entered the relationship, what it must deliver, and what would trigger reconsideration.
Without that baseline, governance has no reference point. You cannot measure drift if you never recorded where you started.
The Original Intent Document answers three questions:
- Why did we enter this PEO relationship? What specific problems were we solving?
- What must this relationship deliver on an ongoing basis to justify its cost and complexity?
- What conditions or thresholds would trigger a formal reconsideration of the relationship?
This does not need to be a lengthy document. One page is sufficient. But it must exist in writing, reviewed by leadership, and referenced at every quarterly governance review.
If this document does not exist in your organization today — start now. Every quarter that passes without a documented baseline is a quarter where drift cannot be measured, and misalignment cannot be detected until it becomes a financial event.
Step 2: The Quarterly Governance Review
Governance does not live at renewal. It lives in the quarters between renewals.
The single most damaging pattern we observe in PEO relationships is the annual review cycle. The business signs a contract, operates for twelve months with minimal oversight, and then scrambles to evaluate the relationship when the renewal proposal arrives.
By that point, the leverage is gone. The data gaps are too wide. And the decisions that should have been made in quarters one through three now carry urgency, pressure, and limited options.
The Quarterly Governance Review replaces that pattern with a structured cadence built around three monitoring dashboards — each aligned with the six governance domains from Post 2 in this series.
Financial Dashboard
The Financial Dashboard tracks the cost dynamics of the PEO relationship against the company’s revenue and payroll trajectory. It surfaces drift before it compounds.
| Metric | What It Reveals |
| Total PEO cost as percentage of payroll | Whether administrative overhead is growing disproportionately to workforce size |
| Total PEO cost as percentage of revenue | Whether the PEO relationship is scaling with the business or outpacing it |
| Workers’ compensation cost trend | Whether experience modification and claims history are driving premiums in the right direction |
| Benefits cost trend | Whether plan costs reflect intentional selection or passive renewal defaults |
If your finance team cannot populate this dashboard from existing PEO reports, that is the first governance gap to close. Request the data. If the PEO cannot provide it in a usable format, that itself is a signal worth examining.
2026 Regulatory Context: The One Big Beautiful Bill Act introduced “No Tax on Tips” and “No Tax on Overtime” provisions that carry new payroll and benefits requirements, with adjustments to federal income tax withholding effective January 1, 2026. Your Financial Dashboard should reflect whether your PEO has properly implemented the new withholding mechanics. Additionally, Secure 2.0 now mandates that highly compensated employee catch-up contributions to 401(k) plans must be made on a Roth basis only — with IRS proposed regulations clarifying that Certified PEOs are excluded from the “employer” definition for this determination. If your PEO administers your retirement plan, verify that Roth catch-up provisions are being handled correctly. These are not future concerns. They are current compliance obligations that should appear in your next quarterly review.
Risk Dashboard
The Risk Dashboard monitors the patterns that indicate shifting liability exposure across the co-employment relationship.
| Metric | What It Reveals |
| Claims frequency and severity | Whether workplace risk is increasing and whether the PEO’s safety programs are effective |
| Employee turnover rate | Whether workforce instability is creating compliance and training gaps |
| HR incident reports | Whether disciplinary and documentation processes are functioning or being bypassed |
| Unemployment claims | Whether termination practices are defensible and properly documented |
Risk governance failures surface as patterns, not events. A single claim is an incident. A rising trend in claims frequency across three quarters is a governance signal that demands investigation.
2026 Regulatory Context: Several states have enacted or proposed laws in 2025 and 2026 regulating the use of artificial intelligence in hiring, promotion, and other employment decisions — requiring transparency, bias testing, and recordkeeping to address algorithmic discrimination. If your PEO uses AI-driven tools for recruiting, onboarding, or HR decision support, your Risk Dashboard should include a line item verifying compliance with these emerging requirements. Additionally, paid family and medical leave programs have now been enacted in 14 jurisdictions, with Oregon’s HB 2236 allowing PEOs to elect client-by-client state tax reporting starting January 1, 2026. Multi-state employers should verify that their PEO is handling PFML compliance correctly in every jurisdiction where they have employees. The IRS has also classified employer pickup contributions of PFML premiums as wages subject to federal income and employment taxes under Revenue Ruling 2025-4, creating new reporting requirements that directly impact PEO invoicing.
Operational Dashboard
The Operational Dashboard tracks the service execution of the PEO relationship — the daily performance metrics that leadership rarely examines until the failures become visible.
| Metric | What It Reveals |
| Payroll error count | Whether processing accuracy is stable or degrading over time |
| Service representative changes | Whether continuity of service knowledge is being maintained or eroded |
| Response time | Whether the PEO’s service team is meeting the responsiveness standards set at onboarding |
| Onboarding cycle time | Whether new employee integration is efficient or creating friction for hiring managers |
Operational erosion does not collapse overnight. It degrades incrementally. The dashboard makes that degradation visible before it becomes a systemic problem.
2026 Regulatory Context: The convergence of new payroll withholding rules under the One Big Beautiful Bill Act, Secure 2.0 retirement plan changes, expanding state PFML programs, and AI employment regulations creates an unusually complex operational environment for PEOs in 2026. Each of these regulatory changes introduces new processing requirements, new reporting obligations, and new potential points of failure. Your Operational Dashboard should be tracking whether your PEO’s error rate is increasing as these new requirements take effect. A PEO that was operationally excellent in 2024 may be struggling with implementation in 2026 — and payroll corrections are often the first visible indicator.
If any of these dashboards are difficult to populate — if the data is hard to obtain, hard to interpret, or simply unavailable — that itself is a governance signal. A PEO relationship where the client cannot access its own performance data is not a transparent partnership. It is an information asymmetry that favors the provider.
Step 3: Traffic Light Scoring
Data without interpretation is just noise. Scoring creates clarity.
Each governance domain receives a quarterly score using a simple Green, Yellow, Red framework. The scoring is not based on feelings or impressions. It is based on the dashboard metrics and the questions from the six governance domains established in Post 2 of this series.
| Score | Definition | Action Required |
| GREEN | Metrics are stable or improving. No material concerns. The domain is performing within the parameters established in the Original Intent Document. | Continue monitoring. No escalation needed. Document status for quarterly record. |
| YELLOW | Metrics show a negative trend or a single material concern has surfaced. The domain is drifting from the original intent but has not reached a critical threshold. | Investigate the root cause. Request additional data from the PEO. Identify whether the trend is isolated or systemic. Document findings. |
| RED | Metrics show sustained negative trends, multiple material concerns, or a single critical failure. The domain is materially misaligned with the company’s needs. | Executive review required. Formal discussion with the PEO. Time-bound corrective action plan. Begin evaluating contingency options if the PEO cannot or will not address the gap. |
Escalation Triggers
The scoring system creates clear escalation thresholds that remove ambiguity from governance decisions:
- Two or more domains score Yellow in the same quarter → Investigate across domains for systemic issues.
- Any single domain scores Red → Immediate executive review and formal PEO engagement.
- Any domain scores Yellow for two consecutive quarters without improvement → Escalate to Red protocol.
- Three or more domains score Yellow or Red simultaneously → Comprehensive relationship review and contingency planning activation.
These triggers are not arbitrary. They are designed to surface compounding problems before they reach the point where the only option is a reactive decision under pressure — which is precisely how most PEO transitions begin.
Putting the System Into Practice
The PEO Alignment Monitoring System is not complex. It requires three components, a quarterly cadence, and leadership commitment.
- → One document: The Original Intent baseline.
- → Three dashboards: Financial, Risk, and Operational.
- → One scoring framework: Green, Yellow, Red with defined escalation triggers.
- → One meeting: A quarterly governance review with designated domain owners.
Assign ownership for each domain. Finance owns the Financial Dashboard. HR and legal own the Risk Dashboard. Operations owns the Operational Dashboard. The CEO or COO owns Strategic Alignment and Exit governance. All of them report into a single quarterly review meeting where the six domains serve as the standing agenda.
The meeting does not need to last two hours. It needs to happen. Consistently. With data. And with the authority to act on what the data reveals.
The Discipline Behind the System
Every framework in this series has been built on one principle: governance is not a product, a platform, or a service. It is a discipline.
- The Original Intent Document creates the reference point.
- The dashboards create visibility.
- The scoring system creates accountability.
- The quarterly cadence creates consistency.
- The escalation triggers create decisiveness.
Together, they replace passive outsourcing with active governance.
Most businesses will never need to exit their PEO. Most PEO relationships, properly governed, deliver significant value over time. But the difference between a PEO relationship that compounds value and one that compounds hidden cost is not the PEO itself.
It is whether anyone is watching.
Governance is proactive discipline, not reactive frustration. The companies that practice it do not experience renewal shock. They do not discover compliance gaps at the worst possible moment. They do not realize their PEO model stopped serving them two years ago. They know. Because they built a system to know.
Coming Next: In the next post in this series, we will identify the early warning signs that your PEO relationship is drifting out of alignment — the specific patterns and signals that indicate governance gaps before they become financial consequences.
37 years advising employers. Independent perspective. Our advisory fee is paid by the PEO — not by you. Explore our full PEO advisory resources: PEOAdvisor.com

- What exactly should I capture in an Original Intent Document, so it becomes a useful, measurable baseline rather than just a high-level narrative? The document should spell out the specific problems you expected the PEO to solve, the measurable outcomes that justify staying in the relationship each year, and the clear conditions that would cause you to formally reevaluate or exit. Include explicit targets for PEO cost ranges (as a percentage of payroll and revenue), expectations for risk and compliance (claims experience, audits, AI usage, PFML treatment), and service standards (response times, acceptable error rates, onboarding timelines) so those items tie directly into your dashboards and traffic‑light scores.
- Which concrete reports and data should I ask my PEO to provide so I can assemble the Financial, Risk, and Operational dashboards described here? For the Financial Dashboard, request an itemized admin fee schedule, invoice-level breakdowns by cost category, and periodic summaries of total PEO charges mapped to payroll and revenue so you can track cost ratios and trend.employee cycle. For the Risk and Operational Dashboards, obtain workers’ comp loss runs, OSHA or incident logs, unemployment and HR-issue summaries, plus service metrics such as ticket counts, response and resolution times, payroll error reports, and onboarding cycle times, then organize them using the same structure you would see in modern HR and service-performance dashboards.
- When my quarterly scores show multiple Yellow or Red domains, how do I distinguish between a fixable performance issue and a signal that it’s time to plan a PEO change? If the concerns are concentrated, your PEO is cooperative, and you can document a specific, time-bound remediation plan with clear SLAs and better data access, it is usually appropriate to push for correction while watching whether scores return to Green within the next one or two quarters. If Yellow/Red scores persist across several domains, data transparency remains poor, or prior remediation efforts have stalled, you should treat that as structural misalignment and begin a deliberate transition process—understanding that planning and executing a smooth exit typically requires at least four to six months.